Course
SCH-WSCH Report
Semester credit hour (SCH) & weighted semester credit hour (WSCH) report provides a quick overview for the university, of credit hours and weighted credit hours generated by college by department by level. Beginning with Fall 2013, the report includes the Galveston campus and the Law School. The Health Science Center is not included at this time.
Production
The report is published each fall, spring and summer (combined, unduplicated) semesters. The report is made available soon after the beginning of each semester-- based on certified data extracted from Compass on the 12th class day for fall and spring semesters and the 5th class day for the Summer I and Summer II semesters.
Approximate Availability
- Fall semester – November 15th
- Spring semester – March 15th
- Summer semester – August 20th
Available Editions
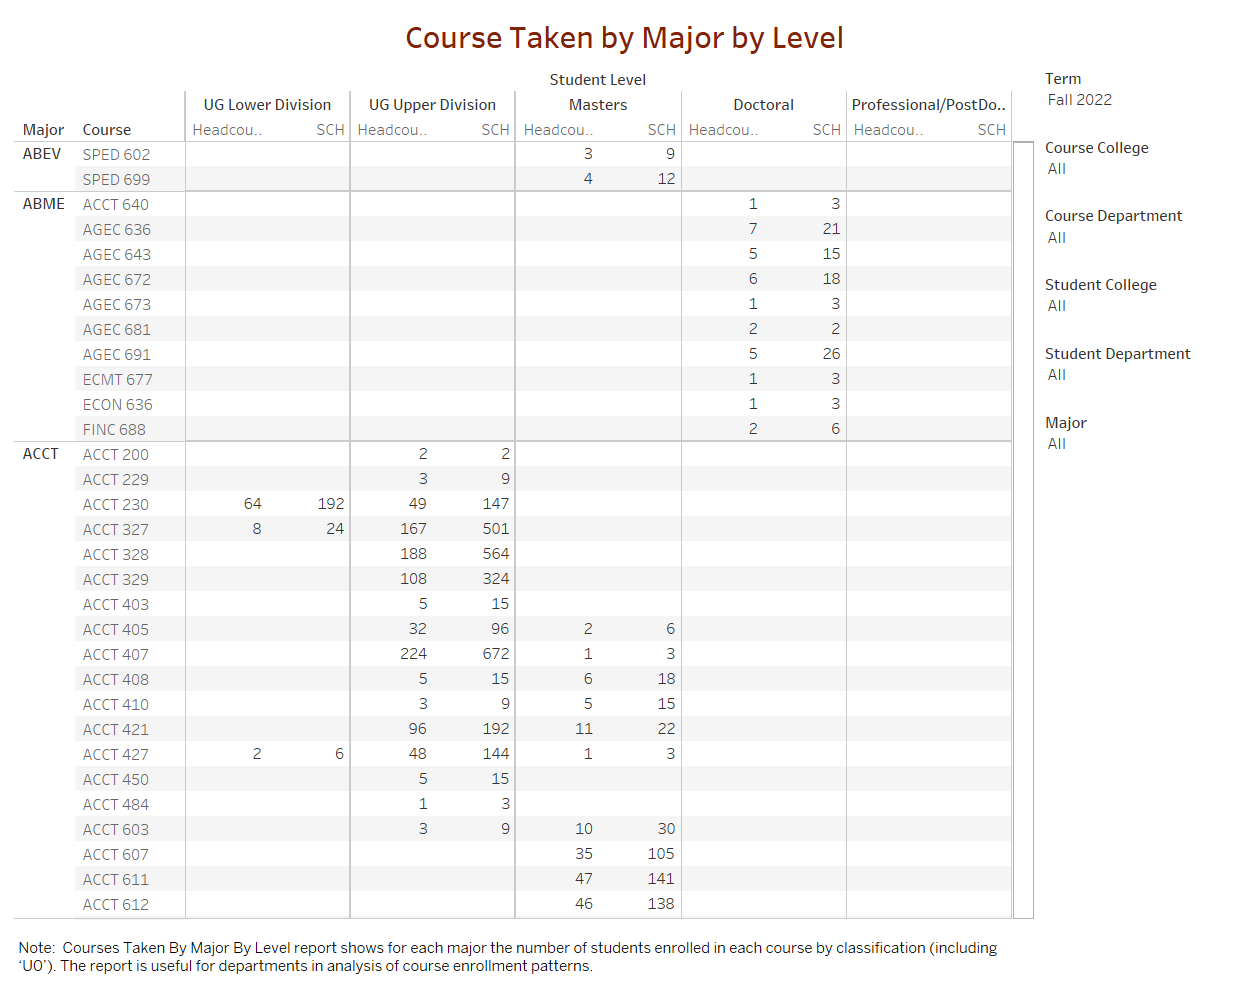
Courses Taken By Major By Level Report
Courses Taken By Major By Level report shows for each major the number of students enrolled in each course by classification (including ‘U0’). The report is useful for departments in analysis of course enrollment patterns.
Production
The report is published each fall, spring, and summer (combined, unduplicated) semesters..
Approximate Availability
- Fall semester – January 10th
- Spring semester – June 15th
- Summer semester – October 20th
Available Editions .png)
Course Profile by Course Department
The report is useful for departmental analysis of enrollment patterns in courses taught by that department. The Course Profile by Course Department report shows each course listed by the teaching department. It combines all sections into one record and shows the number of students taking the course and total SCH broken down by student major and student level/degree objective. It includes course and department subtotals for those measures.
Production
Course Profile by Course Department is published each fall, spring, and summer (combined, unduplicated) semesters.
Approximate Availability
- Fall semester – January 10th
- Spring semester – June 15th
- Summer semester – October 20th
Available Editions 
Average Class Size
Average Class Size report shows the number of sections and the average section size by lecture, laboratory and course level. The report breaks down numbers by university and college, and is produced every fall.
Production
Average Class Size report includes all semesters.
Approximate Availability
- Fall semester – January 10th
Available Editions .png)
Approved Course Inventory
Approved Course Inventory file contains a record for each course that has been approved by THECB to be taught by TAMU. New approved courses are added during the summer.
Production
APPROVED COURSE INVENTORY – The official course inventory is available at The Texas Higher Education Coordinating Board (THECB).
Approximate Availability
- On Demand
Summary
This file contains a record for each course that has been approved by THECB to be taught by TAMU.University Course Inventory
